
Data-Driven Summary of the Current State of the UK Energy Market
In March 2014, Ofgem released a comprehensive report on the state of competition in the energy markets in the UK.1 This report provides an in-depth analysis of how the competition amongst the Big Six and small firms has been functioning. This article aims to show several crucial stats/graphs from the report and provide the summary.1.Tacit Coordination
The first chart below shows how the households’ average dual fuel bills has changed between 2004 and 2014. The second chart shows the pattern of averaged price announcements over the same period. The red/white circles indicate price increases/decreases. The size of the circle is proportionate to the size of the announced average price increase. Both charts imply “tacit coordination” made by Big 6.


From these charts above, average dual fuel prices increased by 24 per cent between 2009 and 2013. Also, the analysis conducted by Ofgem shows that between 2009 and 2012 unit revenues in the supply of energy by the Big 6 increased by 16.9% while unit total costs increased by 13%. Even with the increased environmental taxes imposed from the beginning of 2013, it have been also observed that there is an increase in the aggregate reported profits of the Big 6 over the last four years from £233 million in 2009 to £1.1 billion in 2012. Although further research would be required, no clear evidence has been found showing suppliers have become more efficient in reducing their own costs.
Price announcements appear to take place in identifiable rounds. Of the 16 price rounds, 12 were associated with price increases while four were associated with price decreases. The Big 6 announced their price changes at almost the same time with nearly the same size of price adjustment. Thus, prices appear to be strongly correlated over the period. Ofgem found that the correlation between firms’ price changes and price changes of competitors that preceded the firm during the period of price announcements are high – 0.93 for gas and 0.84 for electricity.
2. Weak Competition
Next, the intensity of energy market competition is analysed. There is strong evidence that suggests that big firms are not fighting hard to win new customers, which is shown in its switching statistics below.
 |
| Source: DNO information request Note: in this figure, switching is defined as the number of customers of the six largest electricity suppliers' customers who have switched to that supplier in that year, as percentage of all electricity customers. |
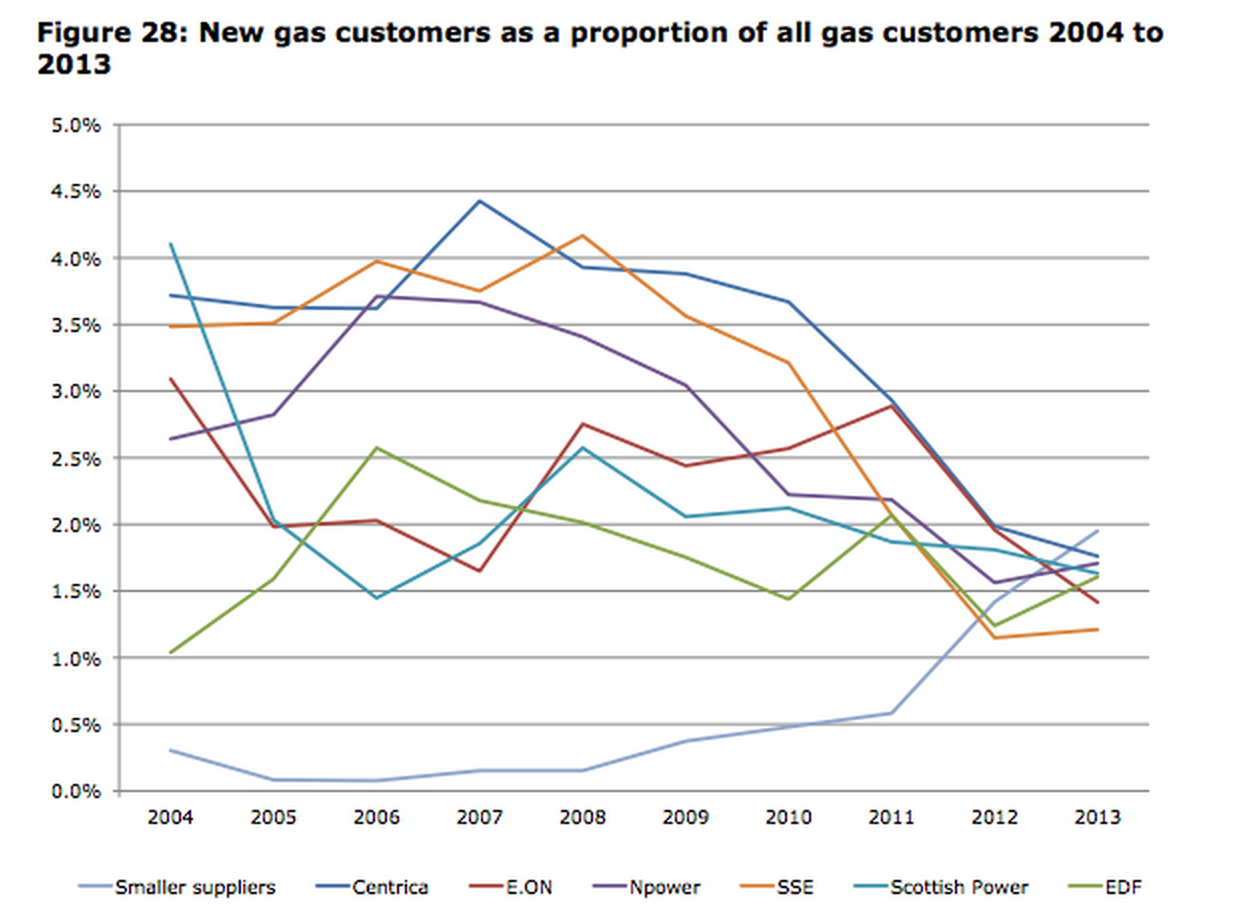
Both electricity and gas switching rates of the Big 6 have decreased to slightly above 1% for the last 5 years. In contrast, the small suppliers have had steady growth in the number of new customers. This implies that the Big 6 are not competing harder than before to get customers from each other as compared to small suppliers.
Switching rates could be low if most customers are happy with their suppliers, but the other evidence suggests that this is not the case. The two bar charts below show how well consumers trust in suppliers and why they do not switch suppliers.
 |
| Source: Ipsos MORI, Customer Engagement with the Electricity Market Survey 2013, p. 52 |
 |
| Source: Ipsos MORI, Customer Engagement with the Electricity Market Survey 2013, p. 22 |
The figures show that majority of suppliers do not tend to trust suppliers. Slightly above 50% of consumers are happy with their current suppliers and for the rest of them switching suppliers is a hassle.
Other evidence of weak competition is shown in the figure below. This figure shows the annual rates of switching suppliers, tariff or payment method. The number of consumers who switched gas or electricity suppliers has been decreasing from nearly 20% to slightly above 10% while number of those who switched just tariff or payment method with the same suppliers has been rising steadily up to 20%. This means that consumers tend to move to a better deal with the same suppliers rather than switching to the different suppliers.
 |
| Source: Ipsos MORI, Customer Engagement in the Energy Market, Tracking Survey 2013, pp. 10-16 |
3. Growing small suppliers
The total market share of new entrants have been increasing steadily up to 5% and is predicted to continue to rise. Since the energy market liberalization in 1998, there have been 24 entries to the energy retail market and 18 companies are still in business currently (May 2014). The graph below shows the new entries and exits to the energy retail market from 1996.

The graph below is the domestic electricity supply market shares for the last ten years.The market share of the Big 6 has remained high at between 11 and 25 per cent over the period while the market share of the small suppliers has remained low. However, there has been a sharp growth of smaller suppliers, and their market share passed over 5 per cent at January 2014. (This includes the acquisition by Utility Warehouse which was previously Telecom Plus, of 770,000 customer accounts from Npower.)
 |
| Source: Meter Point Administration Number (MPAN) data from Distribution Network Operators (DNOs) |
4. Conclusion
Ofgem highlights 5 major recurring problems below which limit entry and restrict expansion for small suppliers: 1.Low liquidity in the wholesale market, 2.Credit and collateral requirements, 3.Difficulties in persuading some customers to switch, 4.Regulatory barriers to expansion, 5.Limits to available interconnection capacity
Despite these barriers, evidence suggess that it is still possible to enter the markets and compete with the Big 6, and that many small suppliers are doing so.
5. Acknowledgement
This article is originally written by Taiki Asakawa, an intern student. Throughout his master's dissertation is in UK electricity market reberalisation, he brought us meaningful insights of the electricity market situation and issues. Let me thank him again for his dedicated contribution.
This is a really interesting, science-driven approach to the current situation in the energy market. IWe are definitely going to follow the further development of your company, great work!
ReplyDeleteCompare Energy Tariffs, Compare Gas and Electricity Prices Tariffs
ReplyDeleteCompare Energy Tariffs are in LLOYD ENERGY. Comparing cheap business electricity prices tariffs makes it easy.
compare energy tariffs
energy tariffs
compare electricity tariffs
compare gas and electricity tariffs
compare energy company tariffs
compare energy suppliers tariffs
compare electricity tariffs online
compare utility tariffs
Cheapest Electricity Supplier for Small Business, Top Energy Supplier
ReplyDeleteLLoyd Energy can help you find Cheapest Electricity Supplier for Small Business. The Best Energy Supplier in UK. By Biggest UK Supplies EON etc. 100% utility
Cheapest Electricity Supplier for Small Business in UK
Cheap Business Electricity Suppliers
Small Business Electricity Suppliers
Small Business Electricity Prices
Business Energy Suppliers in UK
Cheapest Gas Supplier and Zero Standing Charge on Gas Prices
ReplyDeleteCheap Gas Supplier on LLOYD ENERGY. Switch Gas Everyday for cheaper Gas Prices + Zero Standing Charge on Gas Prices
Cheapest gas Supplier for Small Business in UK
Cheap Business gas Suppliers
Small Business gas Suppliers
Small Business gas Prices
Business Energy Suppliers in UK
Micro Business gas Comparison